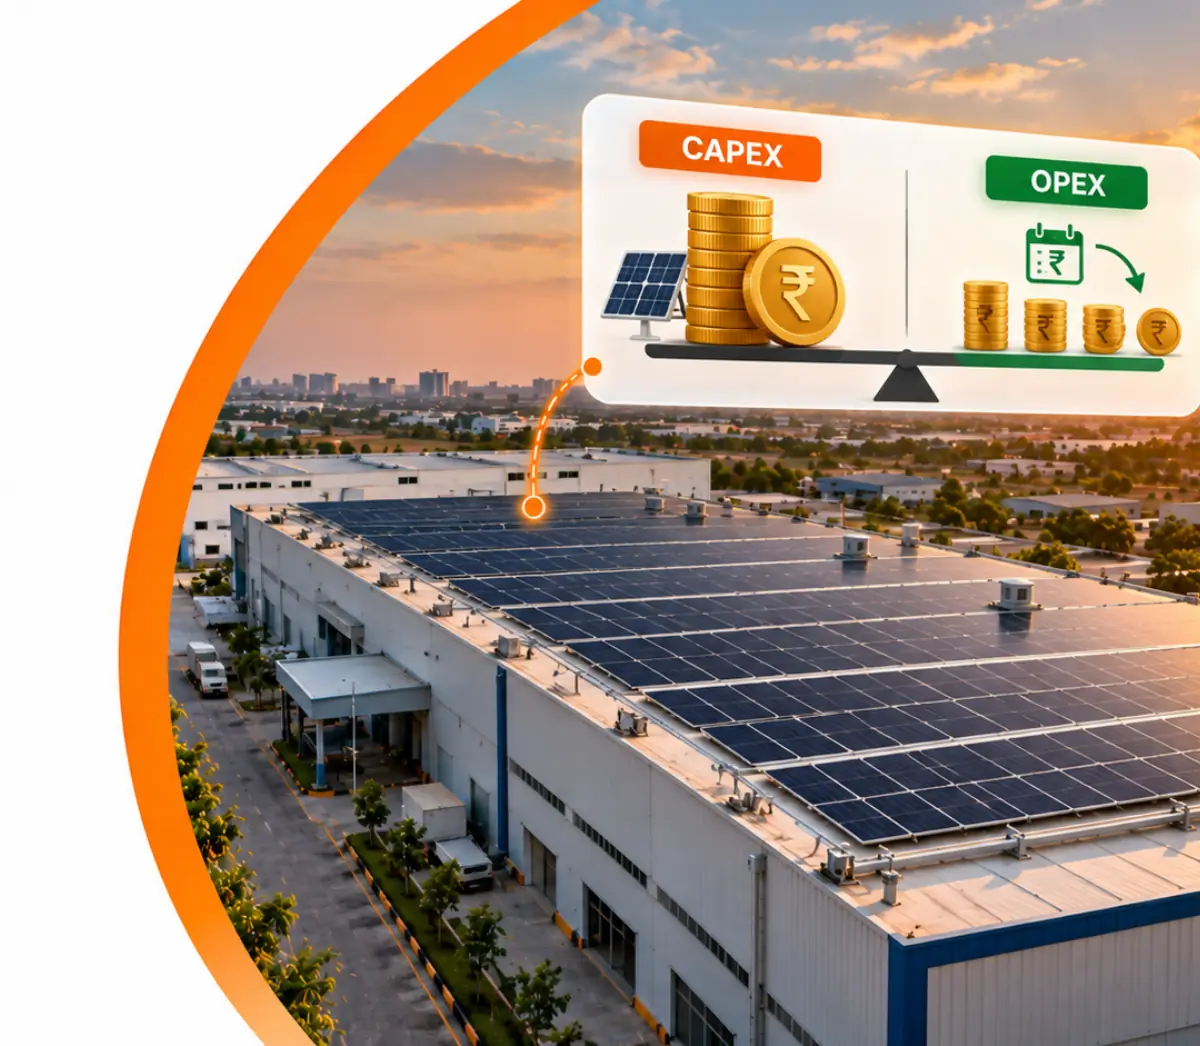
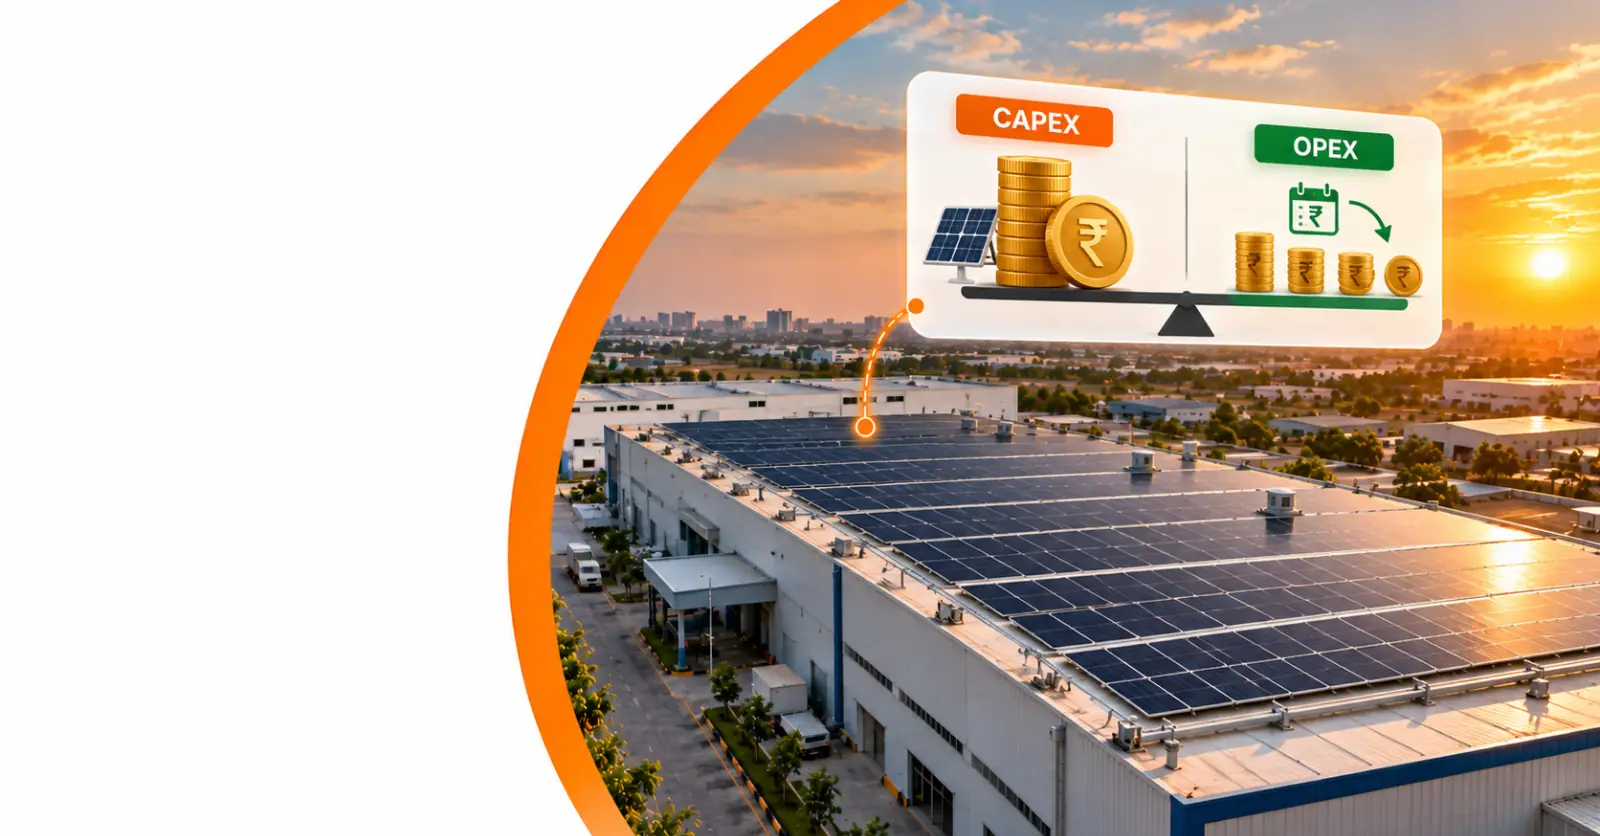

Compare CAPEX vs OPEX solar for businesses. Understand upfront costs, cash flow, ownership, ROI and long-term savings before choosing a commercial solar model.
A business decides to install a 500 kW rooftop solar plant.
The engineering can be identical. The panels can sit on the same roof. The electricity can power the same factory.
Yet the financial structure can be completely different.
Under one model, the business invests the project capital itself, owns the solar asset and keeps the energy savings.
Under another, a third-party developer funds and owns the plant while the business purchases the solar electricity under an agreed commercial arrangement.
These are commonly referred to as CAPEX and OPEX/RESCO solar models.
Neither is automatically better.
The right question for a CFO isn't:
“Which solar model is cheaper?”
It is:
“Do we want to deploy capital today to maximise long-term savings, or preserve that capital and purchase solar power over time?”
That distinction can materially change the cash-flow profile of a commercial or industrial solar project.
First, What Is CAPEX Solar?
Under the CAPEX model, the business funds the solar project.
In simplified terms:
Business invests → Business owns solar asset → Solar generates electricity → Business captures savings
The company generally takes responsibility for the upfront investment, although financing can potentially be used instead of paying entirely from internal cash.
Because the business owns the asset, it also needs to consider long-term operation, maintenance, equipment warranties, insurance, inverter replacement assumptions and system performance.
The advantage is straightforward:
Once the initial investment has been recovered, the business continues benefiting from electricity generated by an asset it owns.
This explains why CAPEX remains a major model in India's rooftop market. Mercom India Research reported that 85% of rooftop solar capacity installed during 2025 used the CAPEX model, versus 15% under OPEX/RESCO. Mercomindia.com
In Q1 2026, CAPEX still represented 81% of rooftop additions, while OPEX/RESCO had increased to approximately 19%. Mercomindia.com
So this isn't an academic financing comparison. Both structures are being actively used.
What Is OPEX or RESCO Solar?
Under an OPEX/RESCO structure, a third-party solar developer typically invests in, owns and operates the solar plant.
The business does not make the same large upfront capital investment.
Instead, it purchases electricity generated by the system according to the agreed commercial structure, often through a long-term power purchase agreement (PPA).
In simplified terms:
Developer invests → Developer owns/operates plant → Business purchases solar electricity
This shifts the proposition from:
“Should we buy a solar power plant?”
to:
“Should we contract for solar electricity?”
That difference is especially relevant to businesses trying to preserve capital for factories, inventory, machinery, acquisitions or working capital.
Put CAPEX Into Actual Numbers
Consider an illustrative manufacturing business evaluating a:
500 kW rooftop solar system
Assume:
Project investment: ₹2 crore
Annual generation: 7,50,000 units
Grid electricity value displaced: ₹10/unit
Illustrative first-year gross energy value: ₹75 lakh
For simplicity, assume annual O&M of ₹3 lakh and ignore financing costs, taxes, depreciation benefits, degradation and tariff escalation for the moment.
First-year indicative net benefit:
₹75 lakh − ₹3 lakh = ₹72 lakh
Simple payback:
₹2 crore ÷ ₹72 lakh ≈ 2.8 years
After the investment has been recovered, subsequent generation continues creating value for the asset owner, subject to ongoing costs and system performance.
This is why CAPEX can be attractive for a cash-rich business with a long operating horizon.
But there is an important question hidden inside that ₹2 crore:
What else could the company have done with that capital?
Choose the Solar Model That Protects Your Cash Flow
Enersol evaluates your load, tariff and capital strategy before recommending CAPEX, OPEX or a mix.
Solar ROI Is Not the Only ROI That Matters
Imagine the same company has ₹2 crore available.
It has two possible investments:
Option A — Solar
Invest ₹2 crore into rooftop solar.
Option B — Core Business
Use ₹2 crore for:
- a new production line;
- inventory expansion;
- automation;
- opening another facility;
- debt reduction; or
- working capital.
If investing ₹2 crore into the core business generates a significantly higher return than owning the solar asset, OPEX becomes worth considering even if CAPEX solar has the better standalone lifetime economics.
This is the concept of opportunity cost.
Solar should not be compared only with grid electricity.
For a business, capital should also be compared with other uses of capital.
Now Look at the Same Project Through OPEX
Suppose the third-party developer installs the same illustrative 500 kW project.
The business pays no equivalent ₹2 crore upfront project CAPEX.
Assume purely for illustration:
Grid electricity displaced: ₹10/unit
Agreed solar tariff: ₹6/unit
Annual solar consumption: 7,50,000 units
Grid-equivalent energy value:
7,50,000 × ₹10 = ₹75 lakh
Solar electricity cost:
7,50,000 × ₹6 = ₹45 lakh
Indicative first-year difference:
₹30 lakh
The business saves less annually than it might under outright ownership, but it has preserved the ₹2 crore for other purposes.
That is the OPEX trade-off.
CAPEX generally asks you to invest first to capture more of the project's economics. OPEX can reduce upfront capital commitment while sharing part of the economic value with the project developer.
The exact economics depend entirely on the contract and project.
Compare the Cash-Flow Profiles
Using the simplified assumptions above:
| CAPEX | Illustrative OPEX | |
|---|---|---|
| Upfront project investment | ₹2 crore | Minimal/none for plant* |
| Annual solar generation | 7.5 lakh units | 7.5 lakh units |
| Grid value | ₹10/unit | ₹10/unit |
| Illustrative solar purchase tariff | N/A | ₹6/unit |
| First-year gross energy value | ₹75 lakh | ₹75 lakh |
| Illustrative O&M | ₹3 lakh | Typically developer responsibility* |
| Indicative first-year benefit | ₹72 lakh | ₹30 lakh |
| Asset ownership | Business | Developer* |
*Actual commercial terms vary by contract.
This comparison intentionally excludes financing, taxes, depreciation, degradation, tariff escalation, PPA escalation and other project-specific factors.
Those items should be included in an investment-grade model.
A 10-Year View Changes the Conversation
Consider the same simplified project over ten years.
If CAPEX produced ₹72 lakh of net annual benefit every year an intentionally simplified assumption the cumulative operational benefit would be:
₹7.2 crore
Subtract the original ₹2 crore investment:
₹5.2 crore simplified net cash benefit
For the illustrative OPEX case:
₹30 lakh × 10 = ₹3 crore
The difference looks substantial.
But CAPEX required ₹2 crore at the beginning.
OPEX did not require the same upfront plant investment.
That is why simply showing “10-year savings” doesn't settle the decision.
CAPEX vs OPEX: Illustrative 10-Year Cash Benefit
500 kW example using simplified constant annual benefits before tax, financing, degradation, tariff escalation and contract adjustments.
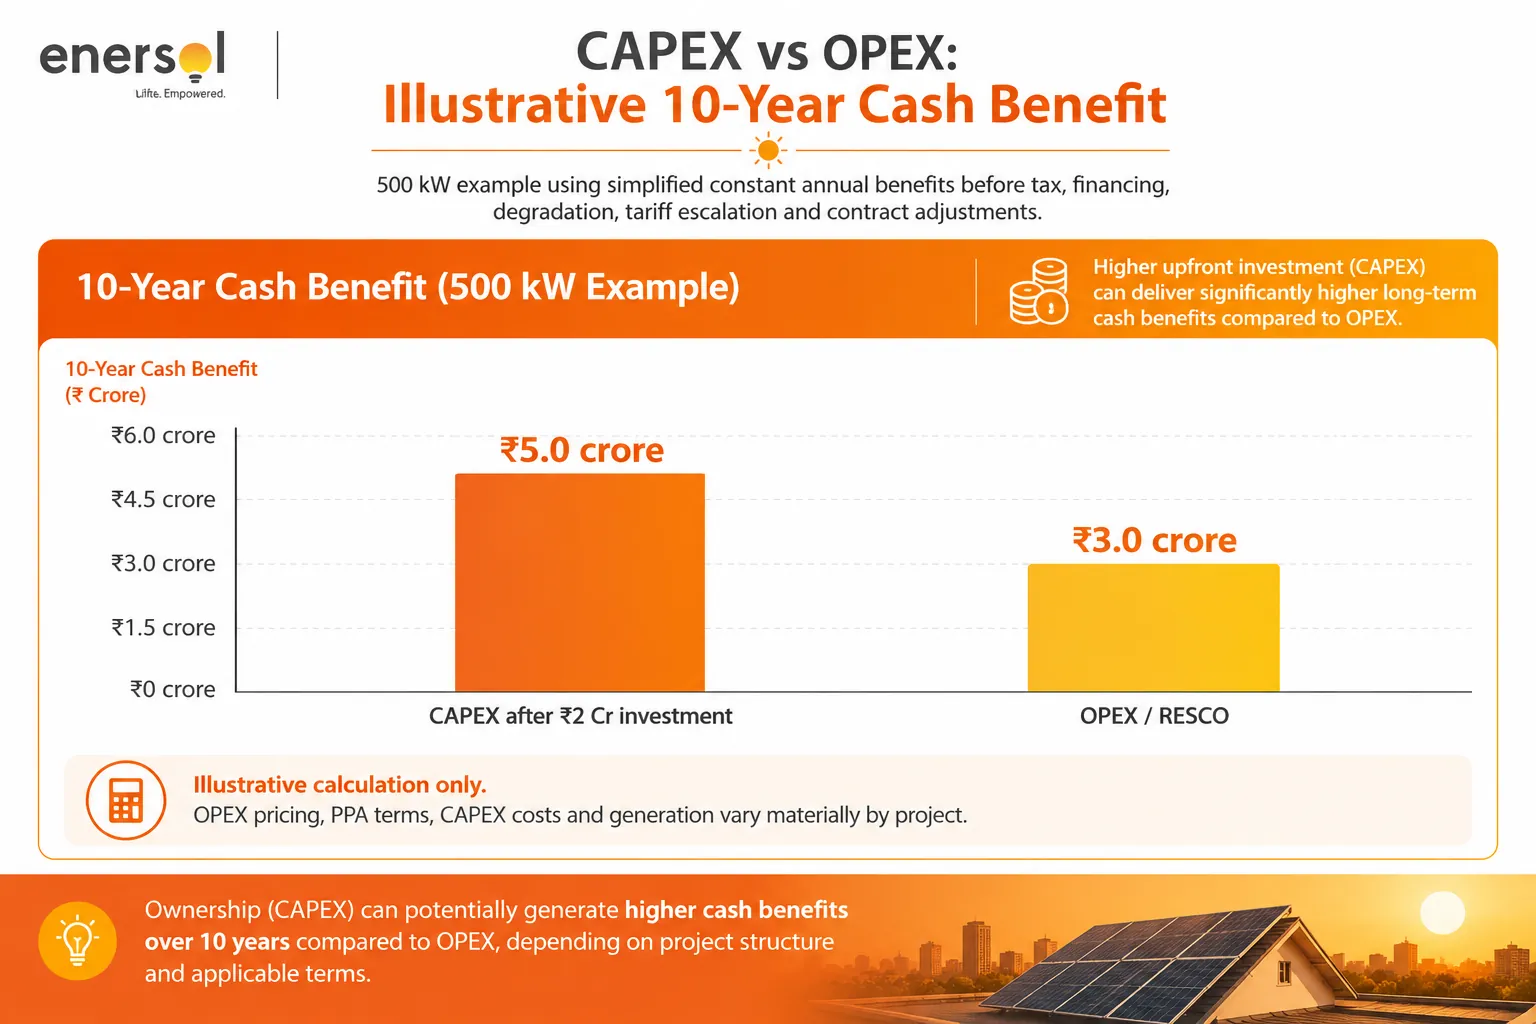
Illustrative only. OPEX pricing, PPA terms, CAPEX costs and generation vary materially by project.
The CFO needs to ask what the preserved ₹2 crore under OPEX could earn elsewhere.
The Break-Even Question Most Comparisons Miss
Suppose CAPEX provides an additional simplified 10-year benefit of:
₹5.2 crore − ₹3 crore = ₹2.2 crore
But OPEX leaves ₹2 crore available to the business at the beginning.
If that ₹2 crore can generate substantial returns in the core business, the comparison becomes much closer.
This is why a professional commercial solar feasibility study should not force every company toward ownership.
A profitable manufacturer with aggressive expansion plans may value liquidity differently from a mature company sitting on surplus cash.
When CAPEX Usually Makes More Sense
CAPEX deserves serious consideration when a business:
- has sufficient available capital or attractive financing;
- intends to operate at the property for many years;
- wants to maximise long-term solar savings;
- prefers owning the energy asset;
- can manage O&M internally or through a service provider;
- has predictable daytime electricity consumption; and
- is comfortable accepting system-performance and asset-management responsibilities.
For companies with strong balance sheets, the long-term economics can be compelling.
But the project should still compete against the company's internal hurdle rate.
When OPEX Can Protect Cash Flow Better
OPEX may be attractive when:
- conserving upfront cash is important;
- capital is needed for business expansion;
- the company prefers predictable energy purchasing;
- management doesn't want solar assets on the same ownership basis;
- third-party O&M and performance responsibility is valuable; or
- The business wants renewable electricity without funding the entire solar plant upfront.
The key phrase is cash preservation.
OPEX does not necessarily create more lifetime solar value.
It can create a more manageable cash-flow structure.
That difference matters.
OPEX Is Not “Free Solar”
This deserves emphasis.
Businesses sometimes hear:
“Zero-investment solar.”
That can make OPEX sound as though electricity is being provided for free.
It isn't.
The developer invests because it expects to recover its investment and earn a return through the commercial arrangement.
The business therefore needs to examine the PPA carefully.
Ask:
What is the starting tariff?
Does the tariff escalate annually?
What is the PPA duration?
Is there a minimum consumption commitment?
Who carries generation risk?
What happens if the property is sold?
What happens if the business closes or relocates?
Who pays for major equipment replacement?
Is early termination possible, and at what cost?
Who owns the plant when the contract ends?
A low first-year tariff can look very different after 15–20 years of contractual escalation.
Illustrative Escalation: ₹6 Isn't Always ₹6
Suppose an OPEX PPA begins at:
₹6/unit
If the contract includes a hypothetical 3% annual escalation, the tariff would rise over time.
Approximately:
Year 1 → ₹6.00/unit
Year 5 → ₹6.75/unit
Year 10 → ₹7.83/unit
Year 15 → ₹9.08/unit
Year 20 → ₹10.52/unit
This does not mean every OPEX agreement has escalated.
Some may have fixed tariffs or different structures.
The point is simple:
Don't compare today's grid tariff with only Year 1 of a long-term PPA.
Compare the full contracted cash flow.
Commercial Solar Is Growing Under Both Models
India's rooftop market shows that businesses are not choosing one financing model exclusively.
Mercom reported that India added 7.1 GW of rooftop solar in 2025, a 123% increase over 2024. CAPEX represented 85% of installations, while OPEX/RESCO accounted for 15%. Mercomindia.com
By Q1 2026, OPEX/RESCO's share had reached approximately 19%, while CAPEX represented 81%. Mercomindia.com
In Q2 2026, CAPEX continued to account for the majority of rooftop additions, while India installed 6.6 GW of rooftop solar in the first half of 2026, up 131% year over year. Gujarat remained among the country's leading rooftop markets. Mercomindia.com
The takeaway isn't that CAPEX “won.”
It's that different businesses are choosing different ways to procure solar based on their financial priorities.
Regulatory and Equipment Compliance Still Matter
Financing structure does not remove technical or regulatory responsibility.
MNRE's current ALMM framework specifies eligible models and manufacturers for applicable categories of solar projects, including open-access and net-metering projects. The ministry's current ALMM page also reflects the implementation of List-II for solar cells and the limited commissioning window associated with certain protected investments through December 31, 2026. Ministry of New and Renewable Energy
For a business considering solar now, equipment eligibility, commissioning timelines and applicable state regulations should therefore be checked at the project-design stage not after procurement.
A cheaper financial model cannot compensate for a project that fails applicable compliance requirements.
Use NPV, Not Just Simple Payback
For a quick discussion, simple payback is useful.
For a large C&I project, it isn't enough.
A proper CAPEX-vs-OPEX financial model should ideally compare:
- Net Present Value (NPV)
- Internal Rate of Return (IRR)
- Payback period
- Annual cash flows
- Financing cost
- Tax/depreciation implications
- O&M costs
- Generation degradation
- PPA escalation
- Grid tariff assumptions
- Exit/termination costs
Why?
Because ₹50 lakh received ten years from now is not economically equivalent to ₹50 lakh received today.
A decision involving a 15–25-year asset needs more than a Year-1 savings calculation.
The CFO's CAPEX vs OPEX Checklist
Before selecting a model, put these figures on one sheet:
| Decision Metric | CAPEX | OPEX |
|---|---|---|
| Upfront investment | ₹___ | ₹___ |
| Solar tariff/effective cost | ₹___ | ₹___ |
| Expected annual generation | ___ kWh | ___ kWh |
| Year-1 savings | ₹___ | ₹___ |
| 10-year cash benefit | ₹___ | ₹___ |
| 20/25-year cash benefit | ₹___ | ₹___ |
| IRR | ___% | N/A/contract-specific |
| NPV | ₹___ | ₹___ |
| O&M responsibility | ___ | ___ |
| Asset owner | ___ | ___ |
| Contract tenure | N/A | ___ years |
| Exit cost | N/A | ₹___ |
Then ask one final question:
What return could we earn if the CAPEX amount remained in our core business?
Now you are comparing capital intelligently.
Where Enersol Fits
For Enersol, a commercial or industrial solar conversation should not begin by pushing CAPEX or OPEX as the default.
It should begin with the business.
How much electricity does the facility consume?
When is that electricity consumed?
How much rooftop or project area is available?
How much solar generation can realistically be absorbed?
What grid tariff is being displaced?
What is the company's capital strategy?
And what return does management expect from its available cash?
Only then does the financing model become meaningful.
The engineering determines how the solar plant should perform.
The financial structure determines how that performance enters your cash flow.
A strong C&I solar proposal needs both.
Final Thoughts
CAPEX and OPEX solve two different financial priorities.
CAPEX says:
Invest capital now, own the asset and aim to capture more of its long-term economic value.
OPEX says:
Preserve capital now, purchase solar electricity over time and transfer defined ownership and operating responsibilities to a third party.
For a cash-rich business with a long operating horizon, CAPEX may deliver stronger lifetime economics.
For a fast-growing company where every crore is competing for factories, machinery, inventory and expansion, OPEX may protect liquidity more effectively.
Neither answer should come from a solar salesperson's preference.
Take your electricity data, solar-generation estimate, project cost, proposed PPA, cost of capital and alternative uses of cash.
Then model both structures over the same period.
The best commercial solar model isn't simply the one that saves the most electricity cost. It's the one that makes the strongest use of your company's capital.