

Explore how captive solar for industries can reduce grid dependence, lower electricity costs and support long-term savings with industrial solar solutions.
For an energy-intensive factory, electricity is not simply another monthly bill.
It is part of the cost of every product leaving the plant.
A manufacturing unit consuming 30 lakh units a year at an effective grid energy cost of ₹9/unit is dealing with electricity worth roughly:
₹2.7 crore every year.
At ₹10/unit, the same consumption represents:
₹3 crore.
Even a ₹1/unit difference changes annual energy cost by ₹30 lakh.
This is why large industrial consumers are looking beyond conventional grid procurement and evaluating captive solar.
The idea is straightforward: instead of buying every unit of electricity from the distribution company, an industry develops or participates in a solar power project primarily for its own consumption. Depending on the structure, that project may be located at the factory itself or elsewhere, with electricity delivered through the grid under the applicable open-access framework.
For industries with large, predictable electricity demand, captive solar can turn part of an externally priced recurring expense into a more strategically managed source of power.
But it is not simply “install a large solar plant and your grid bill disappears.”
The economics depend on ownership, consumption, open-access charges, generation profile, banking rules, location and state regulations.
First: What Does Captive Solar Actually Mean?
Captive power means electricity generated primarily for the consumer's own use.
For an industrial company, there are broadly two practical ways solar can serve its own operations.
On-site captive solar
The solar plant is installed at the factory on rooftops, sheds, parking structures or available land and the electricity is consumed on-site.
Off-site captive solar
A larger solar project is developed elsewhere. The electricity is injected into the grid and delivered to the industrial consumer through open access, subject to applicable regulations and charges.
There is also the group captive model, where multiple consumers participate in a generating project.
Captive status is governed by specific legal requirements. CEEW explains the traditional captive framework as requiring captive users collectively to hold at least 26% ownership and consume at least 51% of the electricity generated, subject to the applicable rules and proportionality requirements. The regulatory framework has continued to evolve, including changes in 2026 aimed at simplifying group-captive compliance. CEEW
So “captive” is not merely a marketing term for a private solar project.
It has a regulatory meaning.
Why Would an Industry Consider Captive Solar?
Start with the grid bill.
Suppose a manufacturing company consumes:
50 lakh units/year
At an illustrative effective energy value of:
₹9/unit
Annual electricity value:
₹4.5 crore
Now imagine captive solar can economically replace 20 lakh of those grid units.
If the landed cost of captive solar after relevant charges works out to an illustrative ₹5.50/unit, the difference is:
₹9.00 − ₹5.50 = ₹3.50/unit
Across 20 lakh units:
₹70 lakh/year
That is the fundamental captive-solar proposition.
Not:
“Solar is green.”
But:
“Can we source part of our industrial electricity at a lower and more predictable long-term cost?”
The numbers above are illustrative. Actual landed solar cost can include generation cost, transmission or wheeling charges and losses, banking charges, scheduling-related costs, duties and other applicable charges.
That complete landed cost, not the solar plant's generation tariff alone, must be compared with grid power.
Grid Tariff vs Captive Solar: Compare the Right Numbers
This is where many proposals become misleading.
Suppose a developer tells you:
Solar generation cost = ₹3.50/unit
Your industrial grid tariff is:
₹9/unit
It may look like:
₹5.50/unit savings
But that isn't necessarily the final calculation for off-site captive solar.
Depending on the project and state, the delivered electricity may be affected by:
- transmission charges;
- wheeling charges;
- transmission/wheeling losses;
- banking provisions;
- scheduling charges;
- electricity duty;
- SLDC-related charges; and
- other applicable regulatory costs.
CEEW's open-access analysis tool specifically models these elements when calculating a renewable project's landed tariff for industrial and commercial consumers. CEEW
So the calculation that matters is:
Landed Captive Solar Cost vs Avoided Grid Electricity Cost
Not:
Solar Generation Tariff vs Electricity Bill Headline Rate
That distinction can materially change the project's economics.
Reduce Your Dependence on Costly Grid Power
Get a free industrial solar feasibility assessment covering rooftop capacity, captive options and landed electricity cost from Enersol.
Put the Savings Into a Factory Example
Consider an illustrative industrial consumer:
Annual electricity consumption: 60 lakh units
Grid electricity value: ₹9/unit
Annual electricity value: ₹5.4 crore
Suppose captive solar supplies:
30 lakh usable units/year
And assume the fully landed captive solar cost is:
₹5.50/unit
Cost of those 30 lakh units from grid:
₹2.70 crore
Illustrative captive solar cost:
₹1.65 crore
Difference:
₹1.05 crore/year
| Source | Units | Illustrative Cost/Unit | Annual Cost |
|---|---|---|---|
| Grid equivalent | 30 lakh | ₹9.00 | ₹2.70 crore |
| Captive solar | 30 lakh | ₹5.50 | ₹1.65 crore |
| Illustrative difference | ₹3.50 | ₹1.05 crore |
Over ten years, if that ₹3.50/unit difference remained constant for simplicity:
₹10.5 crore
That excludes escalation, degradation, financing, regulatory changes and other factors.
But it demonstrates why even a modest per-unit advantage becomes significant at industrial scale.
A ₹1/Unit Difference Is Not Small for Industry
Factory owners sometimes spend weeks negotiating equipment prices while overlooking the value of a small change in electricity procurement.
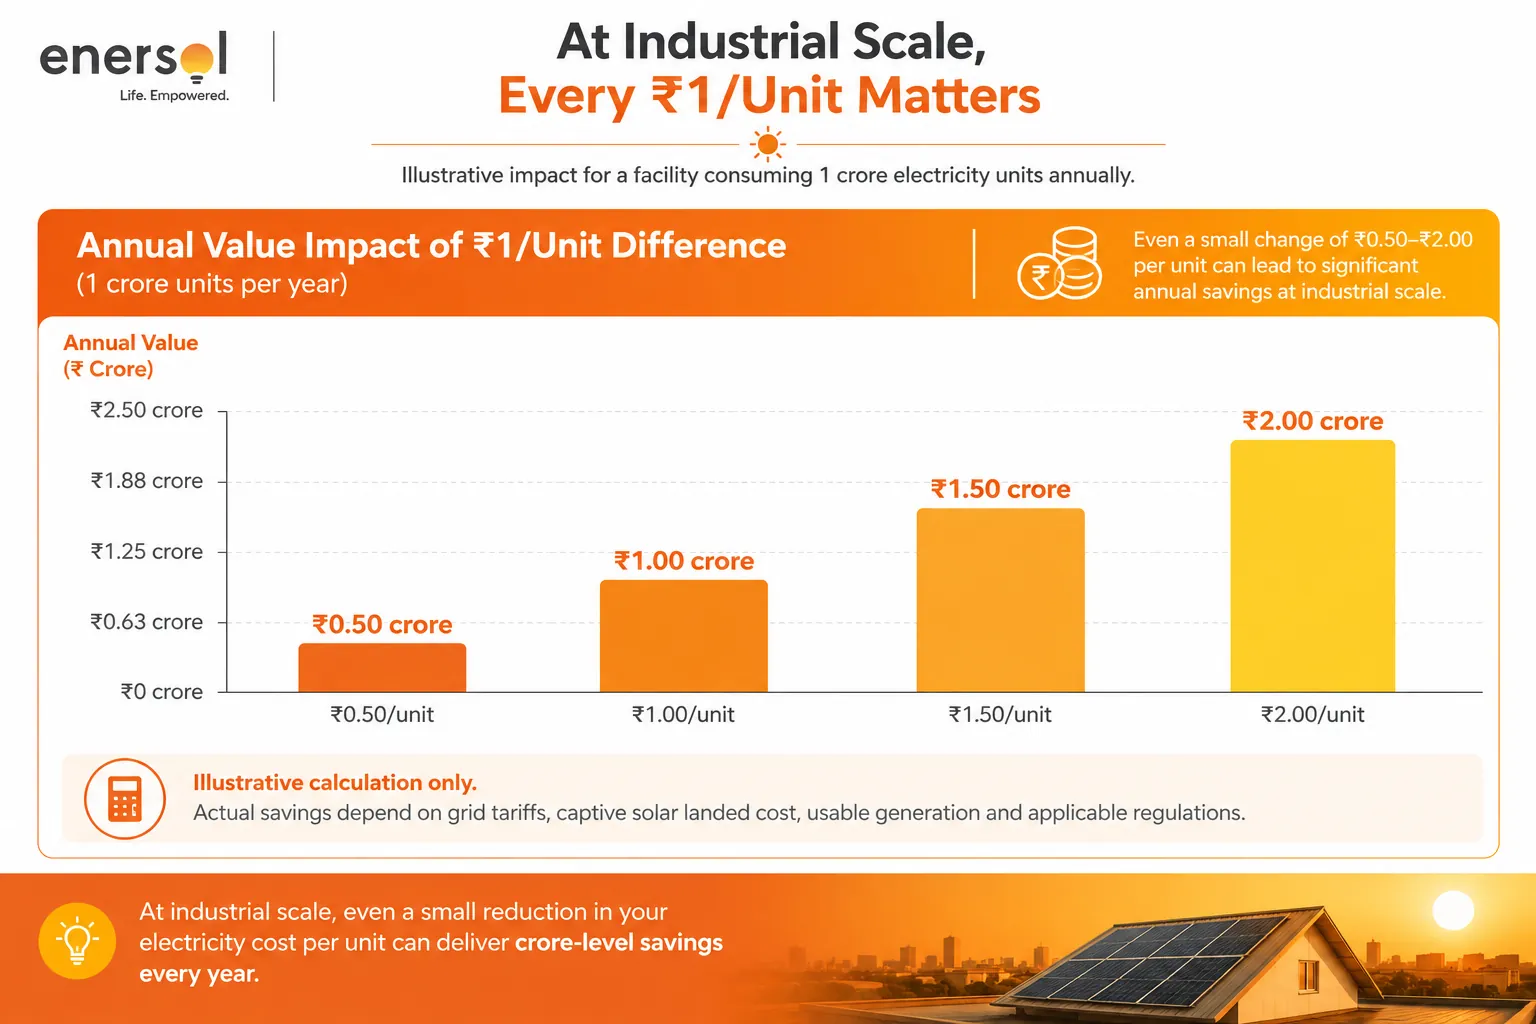
Consider a plant consuming:
1 crore units/year
A difference of:
₹0.50/unit = ₹50 lakh/year
₹1.00/unit = ₹1 crore/year
₹2.00/unit = ₹2 crore/year
At Industrial Scale, Every ₹1/Unit Matters
Illustrative impact for a facility consuming 1 crore electricity units annually.
This is why solar for industries should be discussed as an energy-procurement strategy rather than merely an EPC purchase.
Why Not Just Install Solar on the Factory Roof?
For many factories, rooftop industrial solar should absolutely be evaluated first.
It has a major advantage:
Solar electricity generated behind the meter can be consumed directly at the facility without needing to travel from a remote generating plant through the wider network.
But roof space creates a physical ceiling.
Imagine a factory consuming:
1 crore units/year
Its technically suitable rooftop system can generate:
20 lakh units/year
That still leaves:
80 lakh units
to be sourced elsewhere.
Trying to force more modules onto an unsuitable roof is not the solution.
The industry can instead evaluate a layered strategy:
On-site rooftop solar → Off-site captive/group captive renewable power → Grid supply for balance requirement
This is particularly relevant for large, power-intensive factories.
CEEW's 2026 analysis found that India's C&I sector accounts for nearly half of national electricity demand, while non-DISCOM renewable procurement including third-party open access and captive arrangements represented about 10% of C&I electricity consumption in 2025. CEEW
The opportunity is already substantial, but far from fully utilised.
Captive Solar Is Already Part of a Rapidly Growing Open-Access Market
India's solar open-access market has expanded sharply.
Mercom India Research reported that the country added nearly 6 GW of solar open-access capacity during the first half of 2026, up 42% year over year.
By June 2026, cumulative installed solar open-access capacity had reached approximately:
36 GW. Mercomindia.com
That is significant because open access is one of the mechanisms enabling large industrial consumers to procure renewable electricity beyond what can physically be generated on their own rooftops.
CEEW also reported that an additional 45 GW of solar open-access projects were in various stages of development at the end of 2025. CEEW
Large industries are clearly not treating renewable procurement as a side initiative anymore.
It is becoming part of mainstream energy strategy.
What Is Group Captive Solar?
Not every industrial company needs to develop an entire solar park by itself.
Under a group captive solar structure, multiple consumers participate in the ownership and consumption of a renewable power plant, subject to the applicable captive-power rules.
This can allow an industrial consumer to access utility-scale renewable generation without owning 100% of the generating project.
The attraction is obvious.
Instead of asking:
“Where can we build a 20 MW solar plant?”
a factory can potentially participate in a larger project developed and operated by a specialist.
But a group captive is not simply a PPA with a different name.
Ownership, consumption and compliance requirements matter.
The Ministry of Power's Green Energy Open Access framework also makes an important distinction for captive users: the 100 kW eligibility threshold applying to other Green Energy Open Access consumers does not impose a supply limit on captive consumers. Power Ministry of India
The exact project structure should still be reviewed against current central and state regulations before investment.
Captive Solar Can Reduce Grid Dependence. It Does Not Eliminate the Grid.
This is one of the most important expectations to set correctly.
Solar generation changes throughout the day.
At night:
Solar generation = zero
During cloudy periods:
Generation can fall
During maintenance or outages:
Availability may change
And industrial production does not necessarily follow the sun.
So if a factory requires:
5 MW continuously
a 5 MW solar plant does not mean the factory has become independent of the grid.
At noon on a good solar day, generation may contribute substantially.
At 10 PM, it contributes nothing unless storage or another source is involved.
Captive solar therefore usually reduces grid energy dependence, rather than eliminating the need for grid connectivity.
That distinction matters when calculating savings and planning power reliability.
Match Generation With Industrial Consumption
Suppose a factory operates:
Shift 1
6 AM–2 PM
Shift 2
2 PM–10 PM
Shift 3
10 PM–6 AM
Its electricity demand is relatively constant.
Solar generation, however, is concentrated during daylight.
Now compare that with a factory operating mainly:
8 AM–6 PM
The second facility may naturally align more closely with solar generation.
For captive projects using the grid, applicable banking and settlement rules can help manage timing differences but these vary by jurisdiction and should not be assumed.
A strong feasibility study should therefore model:
Hourly industrial demand
against
Hourly expected solar generation
not just annual kWh totals.
Banking Can Change the Economics
Suppose your captive solar project generates excess electricity during a sunny afternoon but the factory needs additional electricity later.
Can you simply “store” those excess units on the grid and take them back whenever you want?
Not automatically.
Electricity banking is governed by applicable regulations and can involve:
- banking periods;
- permitted withdrawal windows;
- charges;
- losses;
- restrictions; and
- treatment of unutilised banked energy.
These provisions can materially affect captive-solar economics.
This is why a project showing:
Annual generation = 1 crore units
does not automatically mean:
1 crore units of useful grid replacement.
The timing and regulatory treatment of those units matter.