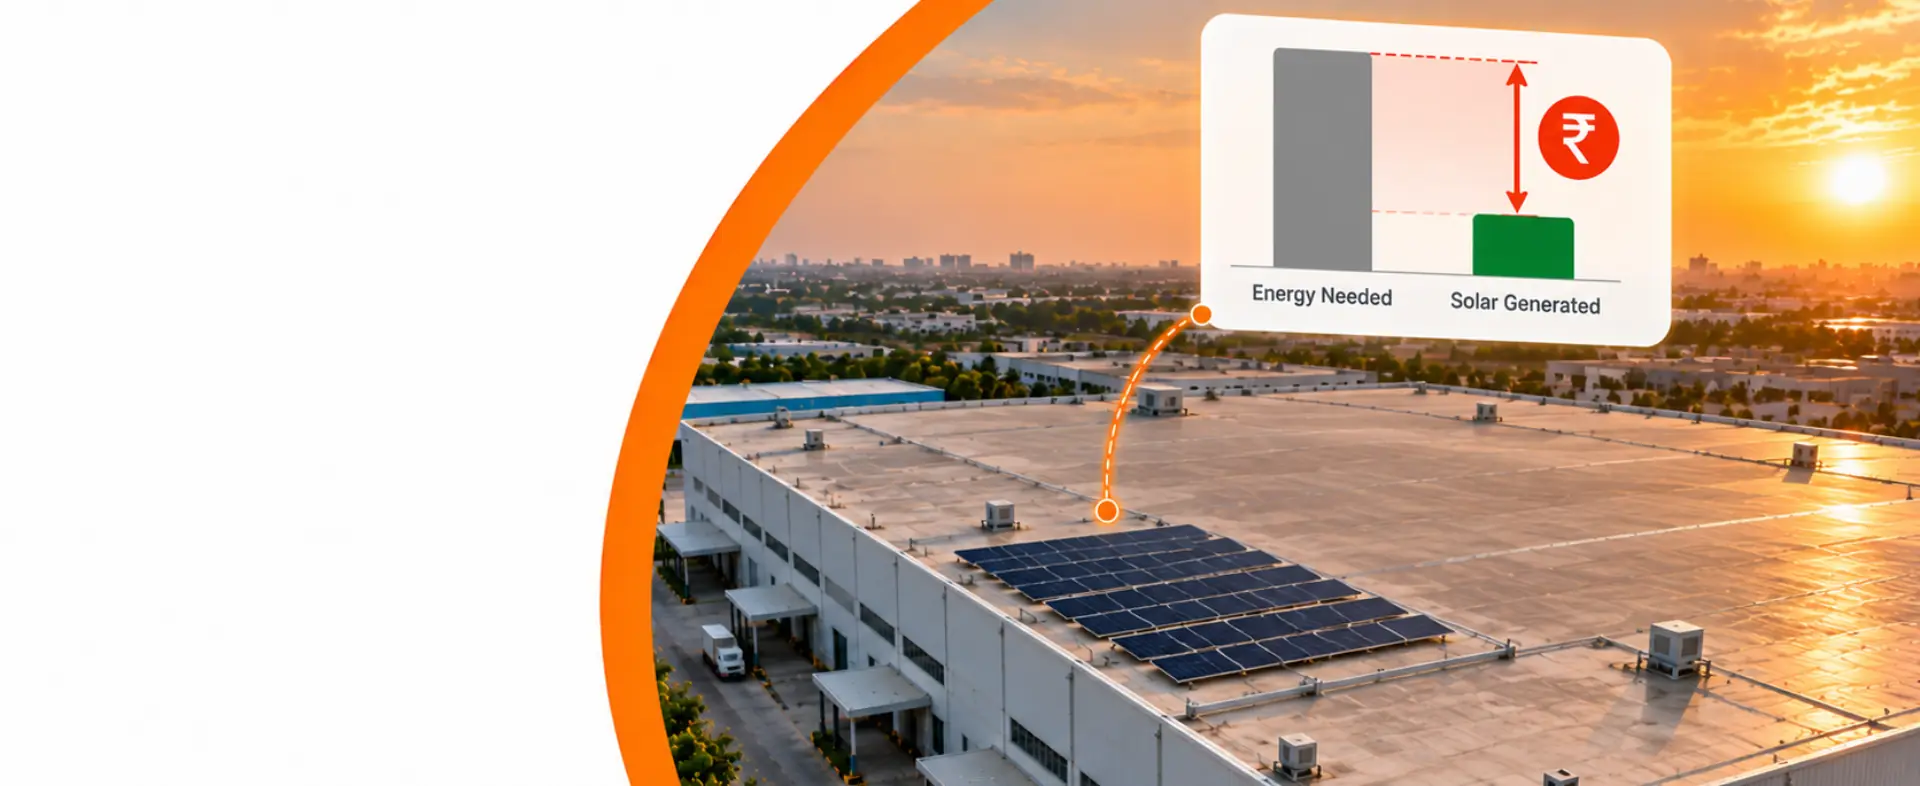
Learn why undersized commercial solar systems limit energy savings and how proper system sizing can improve generation, ROI and long-term business value.
A business installs rooftop solar expecting a major reduction in its electricity bill.
Six months later, the system is generating normally. There are no inverter faults. The panels are clean. Yet the grid bill is still much higher than management expected.
The problem may not be poor solar performance.
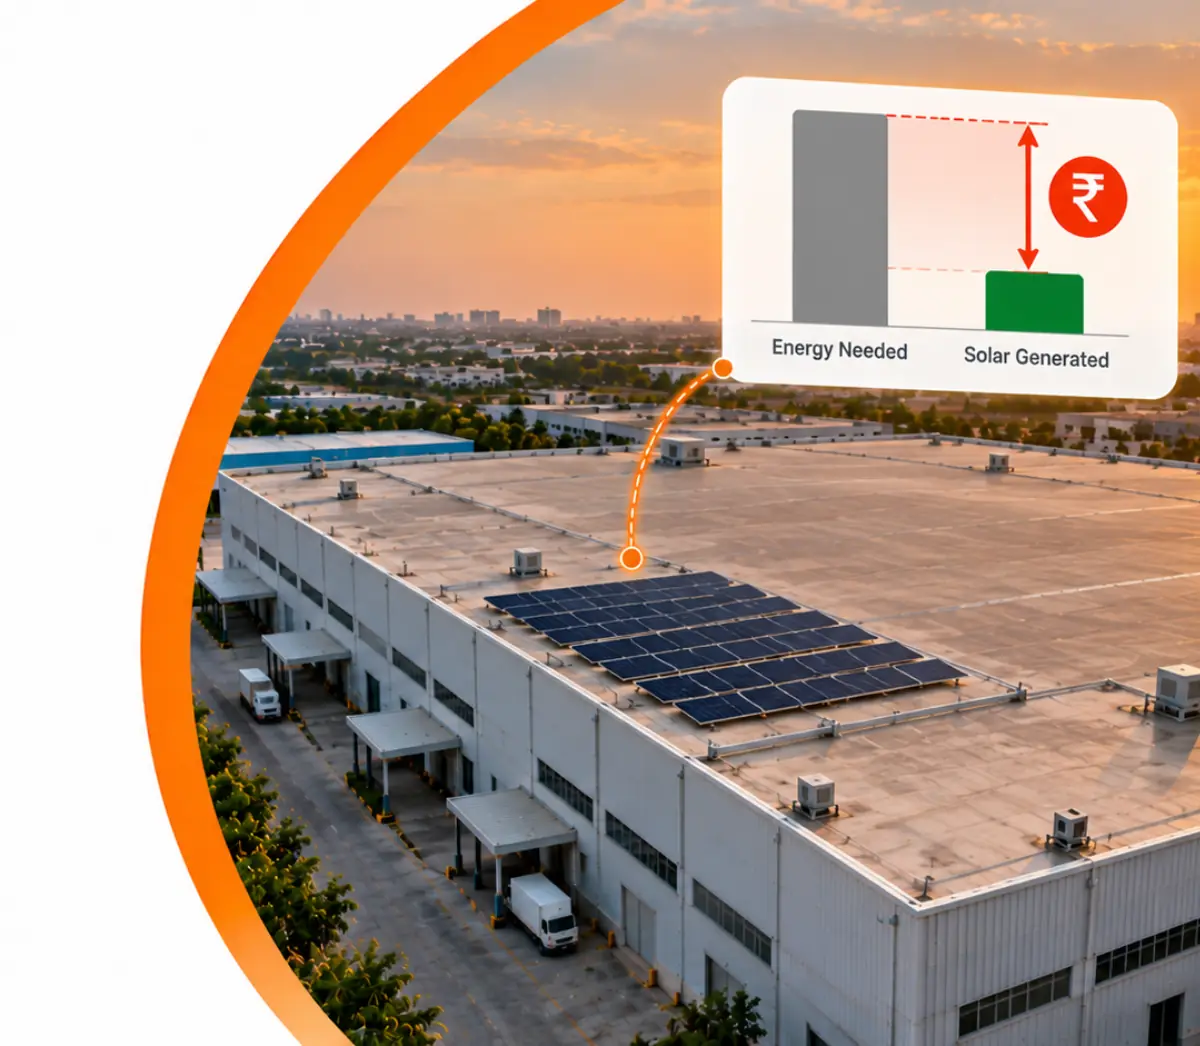
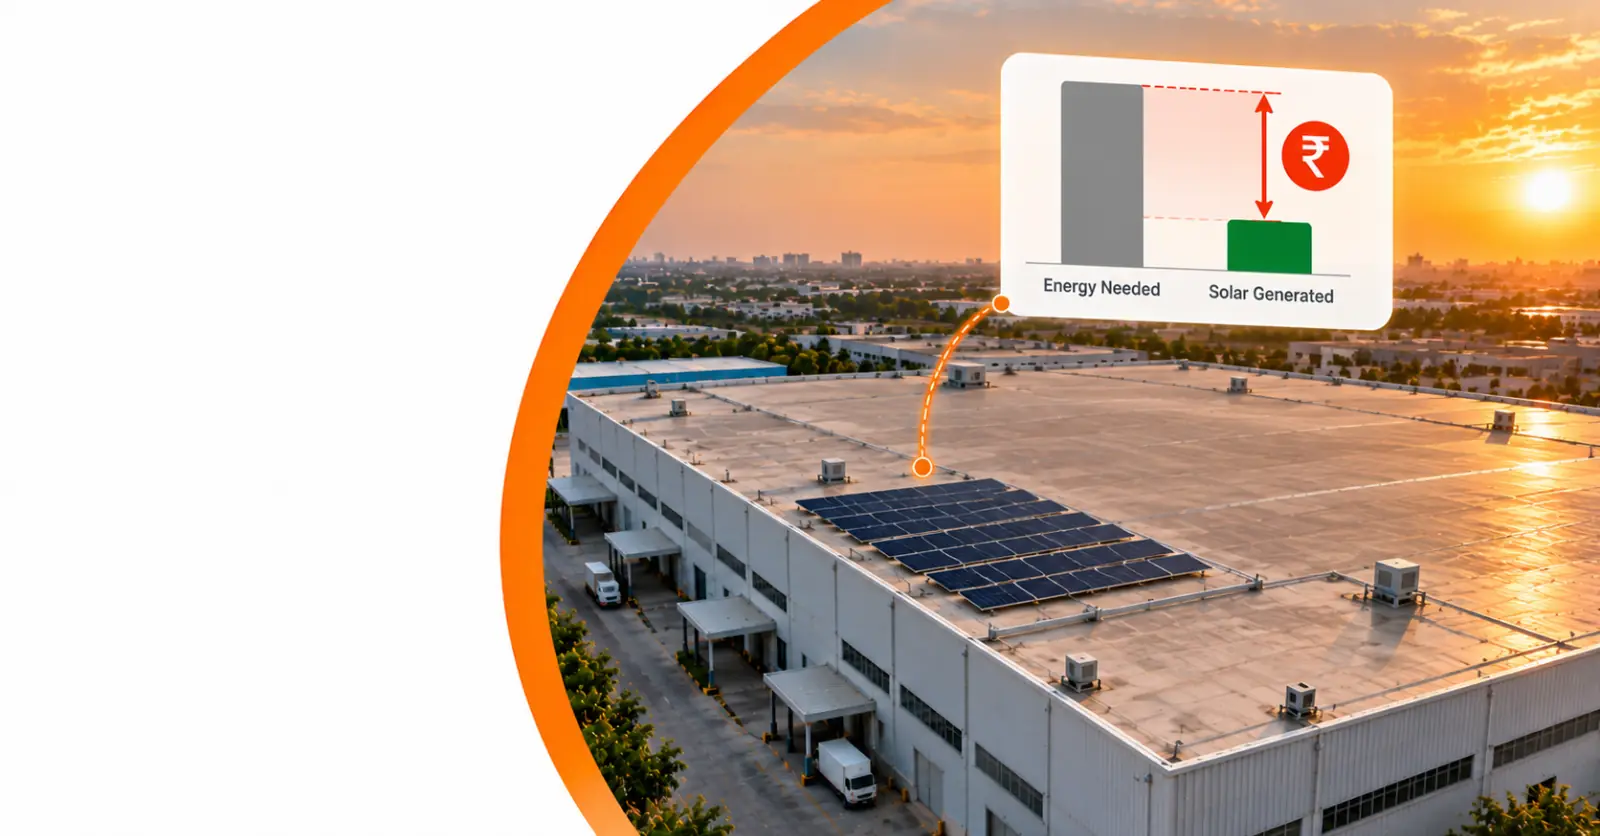
The system may simply be too small for the business's actual electricity requirement.
This distinction matters.
A 300 kW solar plant can perform perfectly as a 300 kW plant and still be the wrong solution for a facility that could economically use 700 kW of solar during operating hours.
For commercial and industrial businesses, solar sizing should therefore begin with energy consumption and load data, not available budget or an arbitrary system capacity.
India's C&I market is already moving in this direction. CEEW reported in 2026 that commercial and industrial consumers account for nearly half of India's electricity demand, while renewable energy supplied through DISCOMs and direct procurement accounted for about 23% of C&I electricity consumption in 2025. CEEW
The opportunity is substantial. But installing solar and optimising solar are two different things.
What Does an “Undersized” Commercial Solar System Actually Mean?
Undersized does not simply mean “small.”
A 100 kW system could be perfectly sized for one business and seriously undersized for another.
The real question is:
How much of the facility's economically addressable electricity demand is the solar system designed to meet?
Consider two businesses.
Business A
Annual electricity consumption: 2,00,000 units
Solar generation: 1,50,000 units
Solar is addressing a significant portion of annual consumption.
Business B
Annual electricity consumption: 12,00,000 units
Solar generation: 1,50,000 units
The same solar plant now covers only:
1,50,000 ÷ 12,00,000 = 12.5%
Nothing is necessarily wrong with the equipment.
The business simply remains highly dependent on grid electricity.
That's why evaluating a commercial solar system only by installed kW can be misleading.
Put the Problem Into Rupees
Take an illustrative manufacturing facility consuming:
15,00,000 units/year
Assume its avoidable grid electricity value is:
₹10/unit
Annual electricity value:
₹1.5 crore
Now compare three illustrative solar-system sizes, using a simplified annual generation assumption of 1,500 units per installed kW.
| Solar Capacity | Illustrative Annual Generation | Value at ₹10/unit |
|---|---|---|
| 200 kW | 3,00,000 units | ₹30 lakh |
| 400 kW | 6,00,000 units | ₹60 lakh |
| 600 kW | 9,00,000 units | ₹90 lakh |
Assume the facility has enough daytime demand to consume all three generation levels and the roof/site can technically accommodate them.
The 200 kW system isn't “bad.”
It could generate exactly as designed.
But compared with the 600 kW option, the business could potentially leave:
6,00,000 units/year
of additional solar opportunity unaddressed.
At ₹10/unit:
₹60 lakh/year
That is why system sizing deserves serious financial analysis.
System Size Changes the Scale of Grid Cost You Can Address
Illustrative generation at 1,500 units/kW/year and electricity value of ₹10/unit.
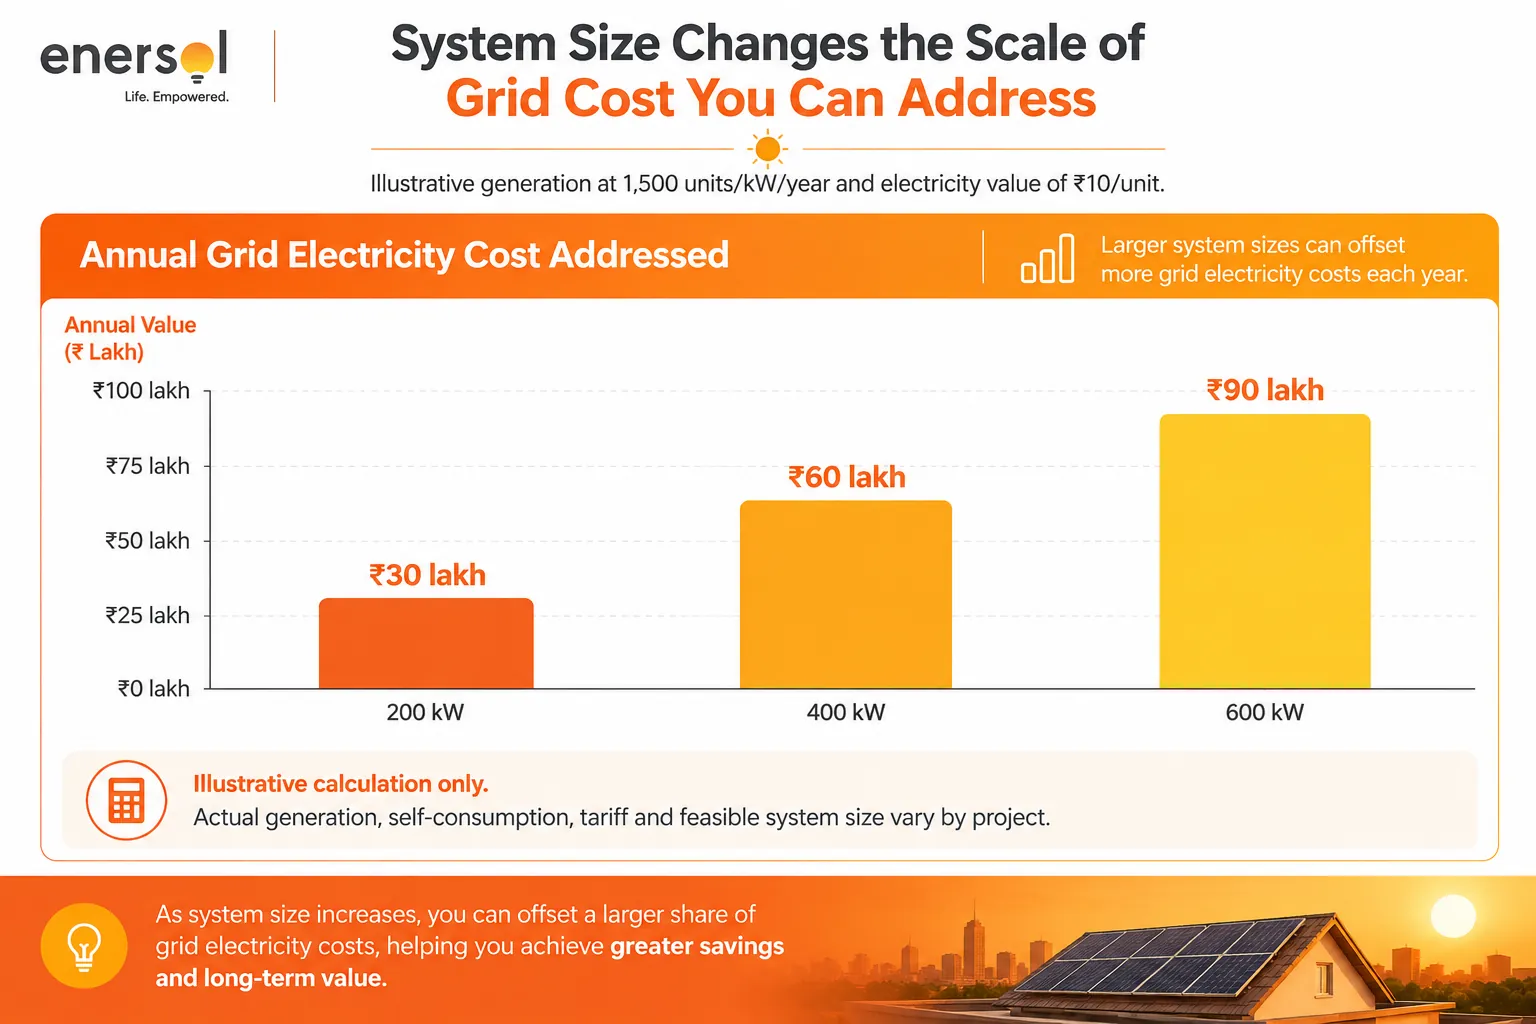
The point is not that every business should install the largest possible system.
It is that a smaller initial quotation can sometimes create a much larger long-term opportunity cost.
Why Do Commercial Solar Systems Get Undersized?
There are several reasons.
Sometimes the customer begins with a fixed budget:
“We have ₹50 lakh. Tell us how much solar that buys.”
That approach reverses the calculation.
The first question should be:
“How much solar can this facility technically and economically use?”
Then financing options can be evaluated.
Other projects are sized according to available rooftop space without analysing other usable roofs, carports or project areas.
Sometimes only one month's electricity bill is reviewed.
And sometimes the installer deliberately proposes a smaller system because the quotation looks easier to approve.
A lower project price can help win an order.
It doesn't necessarily maximise the customer's savings.
Is Your Commercial Solar Plant Sized for Your Real Load?
Get your consumption, daytime load and roof data reviewed before you finalise system capacity.
One Electricity Bill Is Not Enough
Commercial energy use changes throughout the year.
A hotel may have seasonal occupancy.
A food-processing plant may have production cycles.
An engineering unit may add shifts.
A warehouse may expand cooling requirements.
A factory may commission another production line.
Suppose a company uses:
80,000 units/month during its quieter season
but:
1,30,000 units/month during peak production
Sizing from the 80,000-unit bill alone can materially underestimate annual demand.
Before a commercial solar panel installation, ideally review at least 12 months of electricity data.
Calculate:
Annual consumption
Monthly variation
Daytime load
Maximum demand
Contract demand
Operating hours
And, where available:
15-minute or hourly interval data
This creates an energy profile instead of a snapshot.
Annual Consumption Alone Still Doesn't Tell the Whole Story
Suppose a facility consumes:
12 lakh units/year
You might calculate that a solar system generating 12 lakh units annually is the obvious answer.
Not necessarily.
The timing matters.
If the business operates heavily during daylight hours, a large amount of rooftop solar may be consumed directly.
If most electricity consumption occurs at night, the economics change.
For example:
Facility A
Daytime consumption: 75%
Night consumption: 25%
Facility B
Daytime consumption: 30%
Night consumption: 70%
Both consume the same annual electricity.
But the appropriate rooftop solar capacity could be different because direct solar utilisation differs.
This is why experienced commercial solar companies analyse the load profile rather than simply dividing annual consumption by an assumed solar-generation figure.
A Real Indian Example Shows What “Coverage” Actually Looks Like
Recent C&I projects provide useful context.
In March 2026, Mercom India reported that Kedarnath Multigrains commissioned a 659 kW rooftop solar system at its Shahjahanpur facility.
The plant consumes approximately:
2,50,000 units/month
The solar system generates around:
65,000 units/month
That means rooftop solar meets roughly:
26% of monthly electricity requirements. Mercomindia.com
There is nothing inherently wrong with 26%.
Roof area, load patterns, regulations and economics may determine the feasible capacity.
But the example demonstrates why businesses should define the expected solar contribution before installation.
Management should know whether a project is designed to address approximately:
20% of consumption?
40%?
60%?
Without that number, expectations can easily become unrealistic.
Another Project: 1.2 MW Solar, 21% of Demand
In May 2026, DP Cocoa commissioned a 1.2 MW rooftop solar project at its facility in Andhra Pradesh. Mercom reported that the installation was expected to meet about 21% of the company's electricity requirements and potentially save approximately ₹11 million annually. Mercomindia.com
Again, the important metric isn't simply:
“1.2 MW sounds large.”
It is:
“What percentage of the facility's electricity requirement does 1.2 MW actually address?”
For a small commercial property, 1.2 MW would be enormous.
For a power-intensive industrial plant, it may address only part of the requirement.
Solar capacity only becomes meaningful when placed beside the facility's load.
A Recent 550 kW Example Makes the Savings Concrete
A September 2026 case reported by Mercom India provides an even more direct example.
A manufacturing facility in Solapur installed 550 kW of rooftop solar. The system is reported to save approximately:
40,000 electricity units/month
or around:
4,80,000 units/year
with annual electricity-cost savings of more than ₹50 lakh. Mercomindia.com
That gives businesses a useful benchmark—not a number to copy, but a way to think.
Don't ask only:
“How much will a 500 kW plant cost?”
Ask:
“How many units will our 500 kW plant generate on our site, how many can we consume, and what are those displaced units worth under our tariff?”
Now the project becomes measurable.
Undersizing Can Make ROI Look Better on Paper
Here is a less obvious problem.
Suppose:
Option A
250 kW system
Investment: ₹1 crore
Annual net savings: ₹35 lakh
Simple payback:
2.86 years
Option B
500 kW system
Investment: ₹1.9 crore
Annual net savings: ₹65 lakh
Simple payback:
2.92 years
If management looks only at payback, Option A appears slightly better.
But after five years:
Option A
Simplified gross cumulative savings:
₹1.75 crore
Option B
Simplified gross cumulative savings:
₹3.25 crore
Difference:
₹1.5 crore
This simplified example ignores degradation, O&M, financing, tax and tariff changes.
But it demonstrates an important financial principle:
The project with the shortest payback is not automatically the project with the highest business value.
Businesses should also compare NPV, IRR, lifetime savings and capital constraints.
Roof Area Can Be a Real Constraint
Not every undersized-looking project is poorly designed.
Sometimes the roof simply cannot accommodate enough solar.
Large industrial consumers can use enormous amounts of electricity but have limited usable roof area.
Mercom reported in July 2026 that industry participants see open access as an important route for large industrial consumers precisely because rooftop solar is constrained by available space. Mercomindia.com
That leads to a more sophisticated energy strategy:
Optimise rooftop solar first.
Then, if significant electricity demand remains, evaluate:
open-access renewable energy, captive projects, storage or an appropriate combination.
Mercom's January 2026 C&I analysis similarly noted that businesses should consider optimising rooftop solar before moving to open-access solutions for larger requirements. Mercomindia.com
An undersized rooftop system should therefore not automatically be “fixed” by forcing more panels onto an unsuitable roof.
Sometimes the correct solution is a broader procurement strategy.
Future Expansion Can Turn Today's Right Size Into Tomorrow's Undersized System
Imagine a factory currently consuming:
10 lakh units/year
A solar system is designed around today's requirement.
Two years later, the company adds:
- another production line;
- EV charging;
- additional HVAC;
- automation equipment; and
- a second shift.
Consumption rises to:
15 lakh units/year
The solar plant hasn't deteriorated.
But its share of the business's electricity requirement has fallen substantially.
That's why commercial solar design should include one question residential-style calculators often miss:
What will this facility look like five years from now?
If expansion is likely, the design can potentially consider:
- inverter architecture;
- spare roof zones;
- electrical infrastructure;
- future interconnection;
- structural provisions; and
- phased capacity additions.
Planning expansion during initial engineering can be easier than redesigning the system later.
Don't Oversize Either
The opposite mistake is also possible.
Installing the largest plant that physically fits is not automatically good engineering.
If a business cannot self-consume the generation and surplus-export economics are weak or constrained, excessive capacity can reduce project returns.
Suppose:
Solar generation = 10 lakh units/year
but useful self-consumption is only:
7 lakh units
The remaining 3 lakh units need an economically viable destination.
That depends on applicable state regulations, net metering/net billing, export compensation and project structure.
So the goal is not:
Maximum kW.
It is:
Maximum economically useful kWh.
What About Commercial Solar Battery Storage?
Storage can become relevant when solar generation and electricity demand do not align.
Suppose a facility has strong solar generation between noon and 3 PM but significant demand continues into the evening.
Commercial solar battery storage can potentially shift some solar energy into later hours.
But a battery should not be used as a convenient excuse for poor solar sizing.
First determine:
How much electricity is being generated?
How much is being consumed immediately?
How much surplus exists?
When is additional electricity needed?
Then determine whether storage creates sufficient financial or operational value.
Recent C&I experience reinforces this. In a September 2026 Mercom interview on industrial battery economics, an operator noted that battery sizing must follow the customer's actual operating profile and intended use; undersized systems may fail to capture the intended savings, while oversized systems can leave expensive capacity underutilised. Mercomindia.com
The same principle applies to solar.
Size from the energy profile first. Choose equipment second.
India's C&I Solar Opportunity Is Growing Fast
Commercial and industrial rooftop solar is becoming increasingly relevant.
India added 6.6 GW of rooftop solar capacity during the first half of 2026, up 131% year over year. In Q2 alone, industrial installations represented approximately 10% of additions and commercial systems another 5%. Gujarat was among the leading states for rooftop additions. Mercomindia.com
At the same time, CEEW reports that India's commercial and industrial sector represents nearly half of national electricity demand. CEEW
That combination creates a major opportunity.
But the value will not come simply from putting some solar on every available roof.
It will come from designing systems against actual energy demand.
The 8 Numbers Enersol Would Want Before Sizing a C&I Project
A meaningful commercial solar assessment should begin with data.
Before finalising system capacity, gather:
| Metric | Business Data |
|---|---|
| Last 12 months' consumption | ___ kWh |
| Annual electricity spend | ₹___ |
| Daytime consumption | ___ kWh |
| Maximum demand | ___ kW/kVA |
| Contract demand | ___ kW/kVA |
| Operating hours | ___ |
| Planned future load | ___ kWh |
| Usable rooftop/project area | ___ m² |
Then calculate:
Proposed capacity: ___ kW
Expected annual generation: ___ kWh
Expected self-consumption: ___%
Share of annual demand addressed: ___%
Expected first-year savings: ₹___
Projected payback / IRR / NPV: ___
Now management knows what it is buying.
Where Enersol Fits
For Enersol, commercial solar sizing should not start with:
“We have a package for 100 kW, 250 kW or 500 kW.”
It should start with the facility.
Electricity bills show how much energy is being purchased.
Interval data shows when it is being used.
A site assessment establishes how much technically suitable solar capacity can be installed.
The tariff determines the value of displaced grid electricity.
Future expansion tells us whether today's design needs room to grow.
Only after those pieces come together should system capacity be finalised.
For some businesses, the answer may be rooftop solar alone.
For a larger energy-intensive industrial facility, rooftop solar may be the first layer, followed by open access or commercial solar battery storage where the numbers support it.
That is the difference between selling solar capacity and engineering an energy strategy.
Final Thoughts
An undersized commercial solar system doesn't have to fail technically to disappoint financially.
It can generate exactly what was promised on the datasheet and still leave the business purchasing far more grid electricity than necessary.
That is why businesses should stop judging proposals only by:
System capacity.
Project price.
Payback period.
Add three more numbers:
How many annual units will it generate?
What percentage of our electricity requirement will it address?
How much economically usable solar opportunity are we leaving behind?
Sometimes a smaller system is correct because of roof constraints, capital limits, regulations or load patterns.
But if a business has sufficient daytime demand, technically suitable space and attractive solar economics, deliberately undersizing the plant simply to reduce the initial quotation can create years of avoidable grid purchases.
Before approving your next commercial solar panel installation, ask your installer to model at least three capacities side by side.
For example:
250 kW vs 500 kW vs 750 kW
Compare investment, annual generation, self-consumption, grid units avoided, annual savings, payback, IRR and 10-year value.
The answer may surprise you.
The cheapest solar proposal is not necessarily the lowest-cost energy strategy.